back to features overview
Like to know how many bluff catchers we have on the river using the equity graph for the current street?
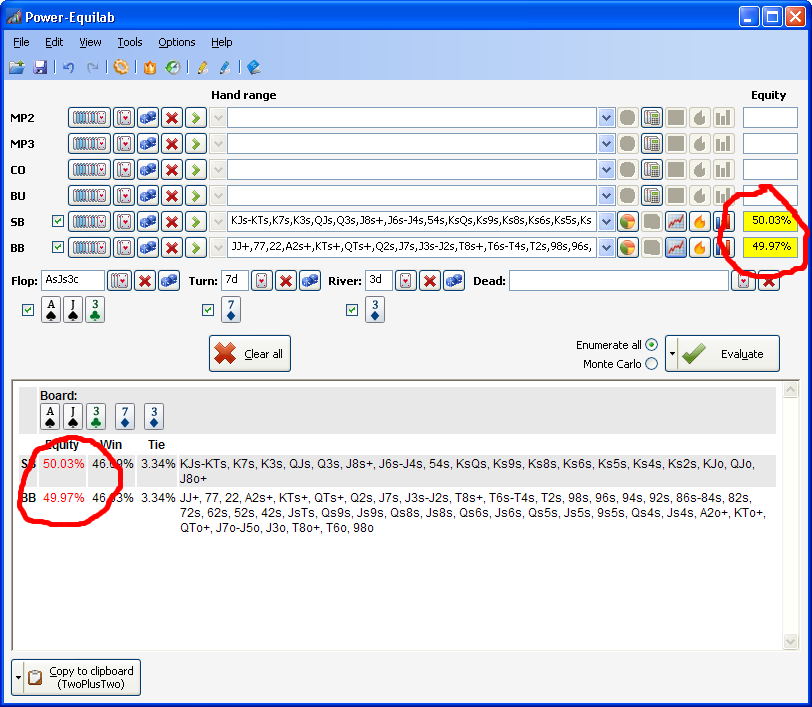
Let's suppose we have the following scenario:
We have busted Flushdraw on the river an the equity range vs. range is near about 50%.
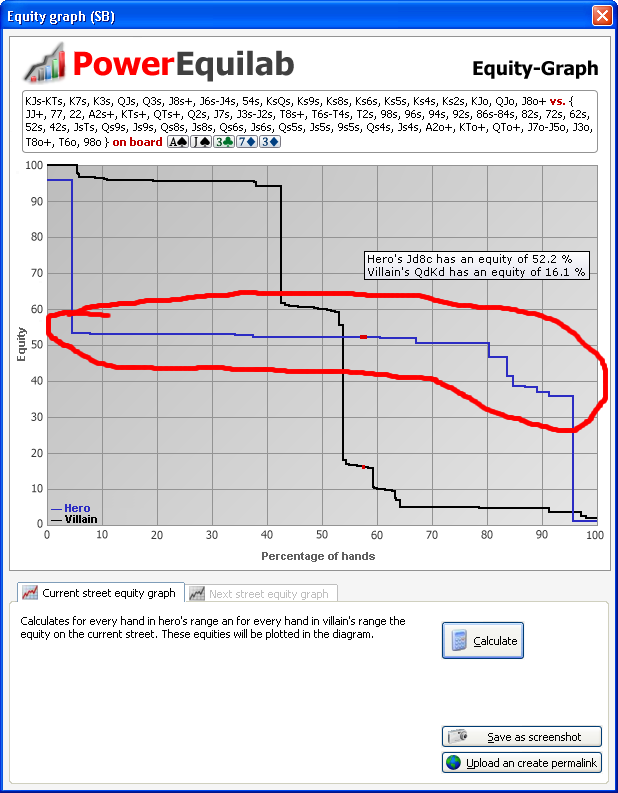
So ... what is the distribution of equities in our range?
Use the equity graph and there the option "Current street equity graph". While moving the mouse, you can see every hand in the ranges with the corrresponding equity.
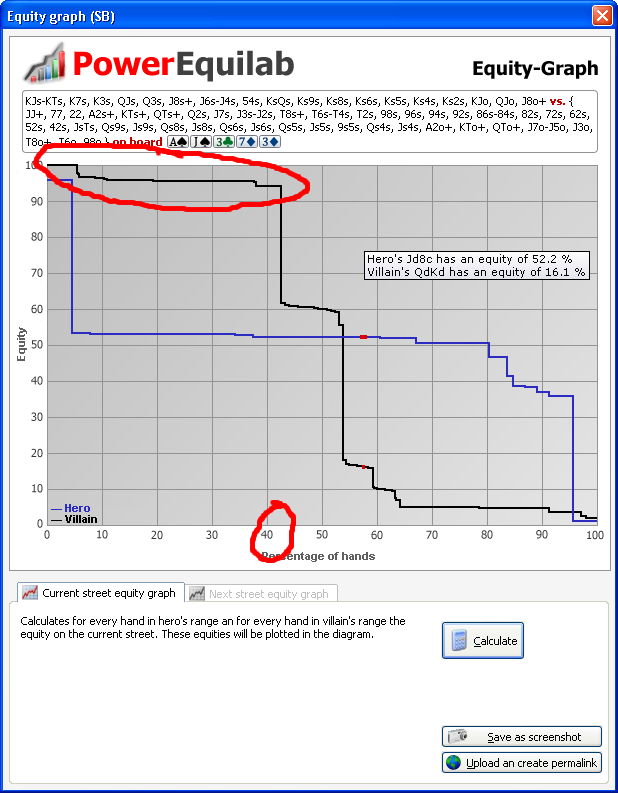
As we can see, villains range contains about 42% of nut hands.
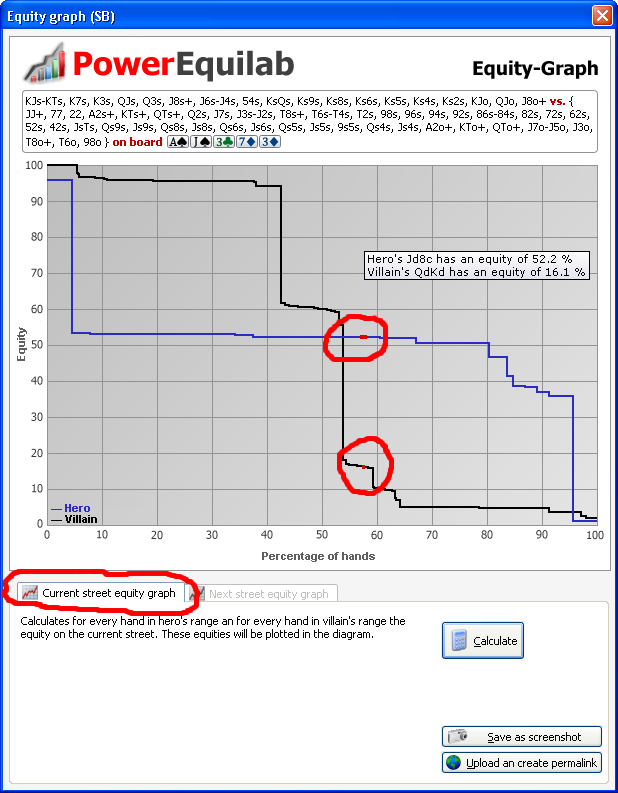
We see also, that villains range contains a ton of bluffs-
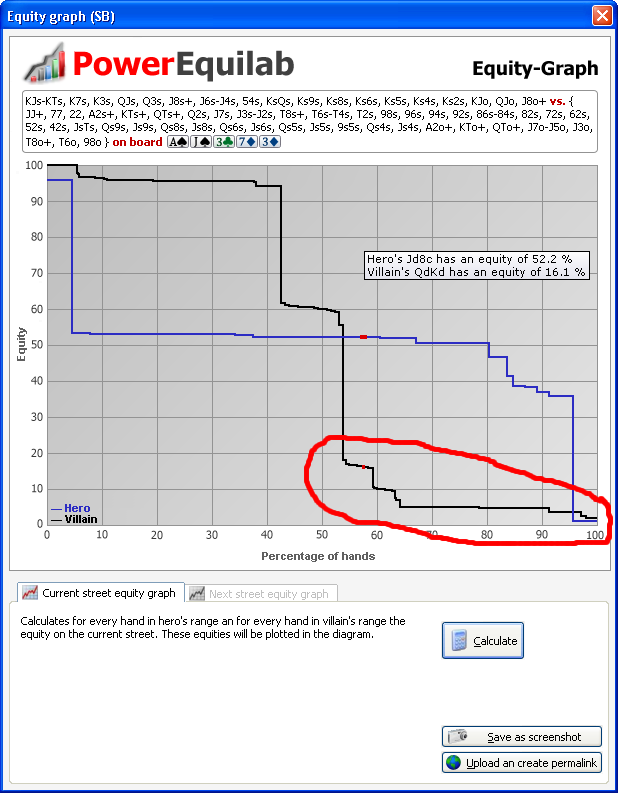
An finally ... heros range contains almost exclusivly bluff-catchers.